User flows
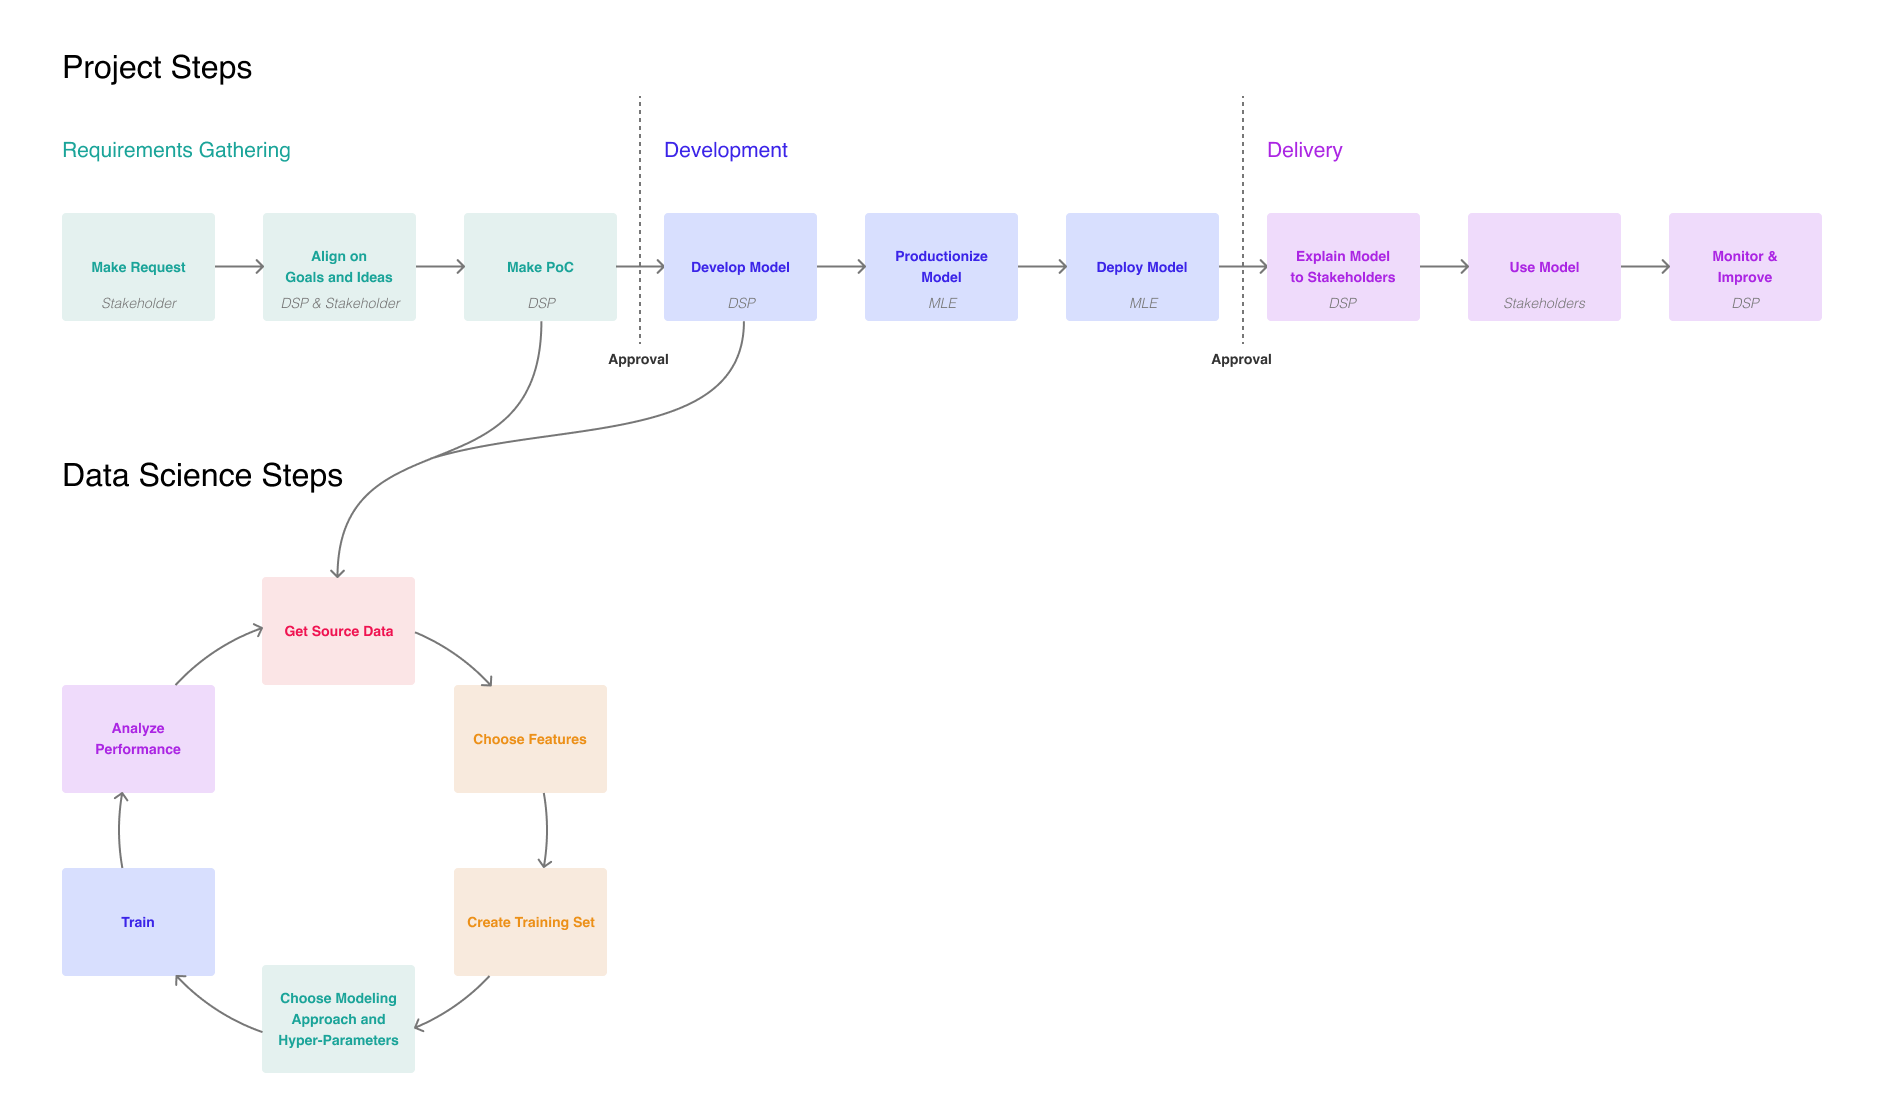
Our key user flows contained three key phases: requirements, development, and delivery.
Create the first product for a new company
Formed initial hypothesis. Collaborated on research. Led problem definition, product strategy, design, iterations, and sales.
As I was working on MLOps tools, I noticed a pattern in how Data Scientists talked about their relationships to others in their businesses. I got the sense that there was often tension in their relationships with non-technical stakeholders, and I hypothesized that Data Scientists were focusing on statistics-oriented metrics rather than the business outcomes that other stakeholders valued.
Knowing the amount of impact data science can have for businesses, and knowing how much data science teams cost, I thought there might be an opportunity to solve a valuable problem for companies.
I started by reaching out to Melissa Federoff, a researcher who I really enjoy working with. We kicked off a set of interviews with 5 Data Scientists and 5 of their business stakeholders.
We found a clear signal that there was a problem: Lots of data science projects were getting thrown away and completely redone before being successfully delivered. From the stories and accompanying estimates that we were hearing, it sounded like 50-60% of data science resources were getting wasted.
So, I quit my job to start working on this full time!
As we worked to define the problem, we identified two main personas with related goals and problems.
Data Scientist
Business Stakeholder
I started by outlining data science project workflows based on the stories we had heard and on my existing domain knowledge. I wanted to use the workflows to help us align on the main user actions that our product would support and how the features and objects in our product would need to flow across them.
Our key user flows contained three key phases: requirements, development, and delivery.

Together with this, I defined a domain model showing the objects that would support the user flows. The key object was a project. Projects would contain "decisions" which represented the core pieces of alignment.
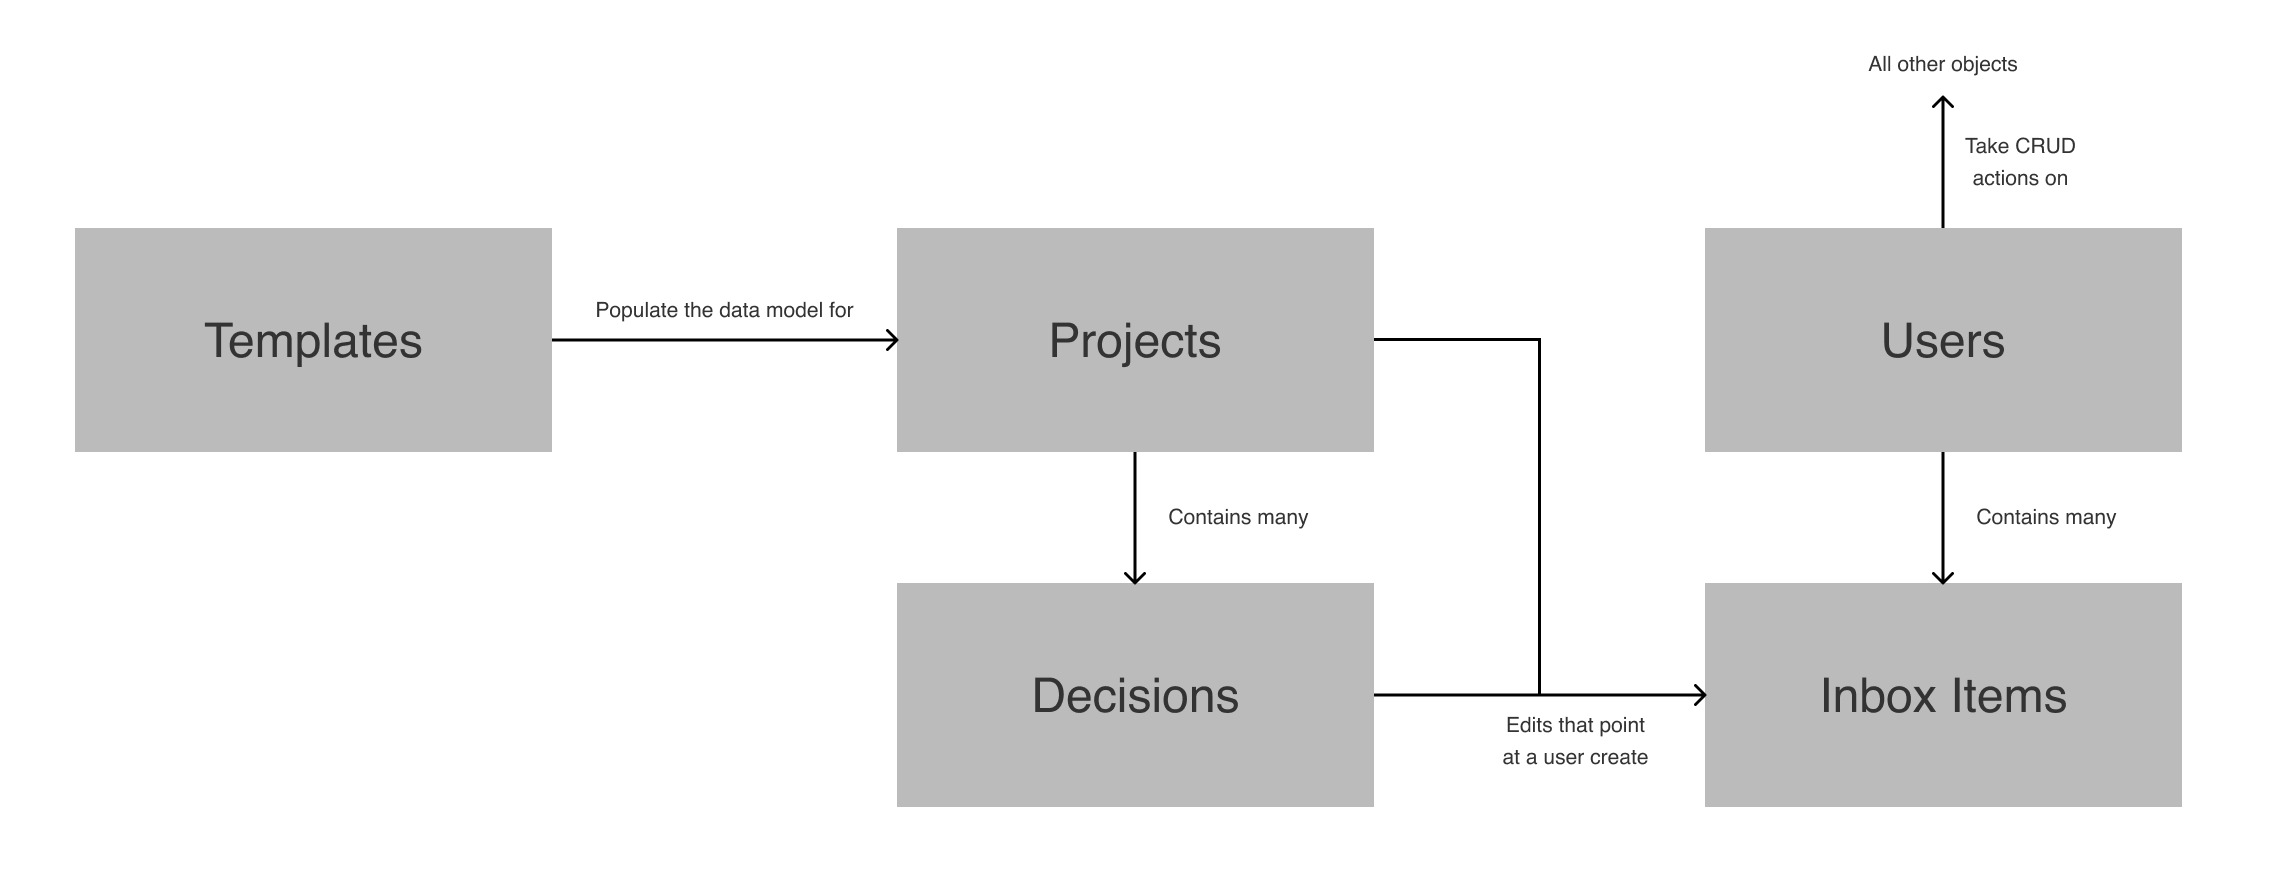
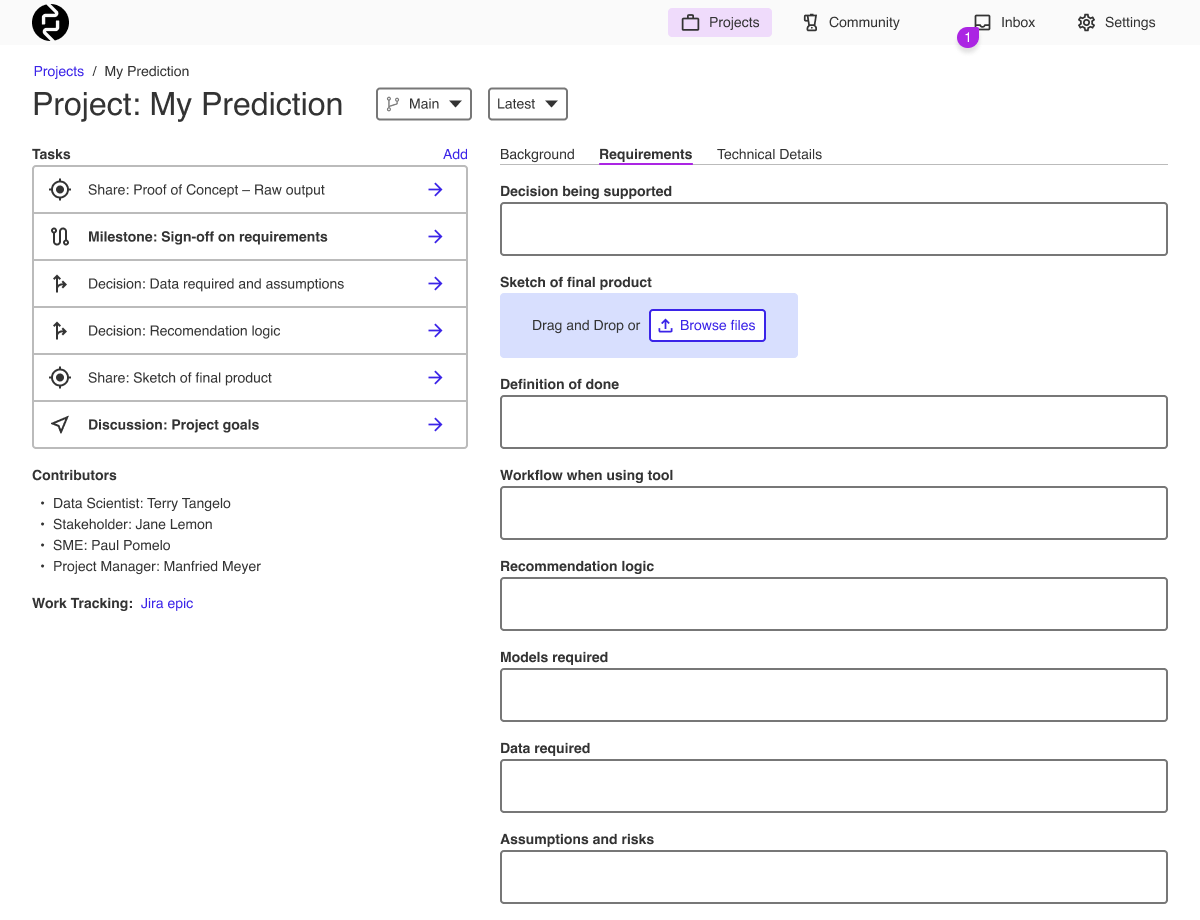
Combining these two assets, I set the bones of the product: Projects would flow through a lifecycle, existing in one phase at a time. Each phase would have its own project UI, corresponding to the unique goals of that phase.
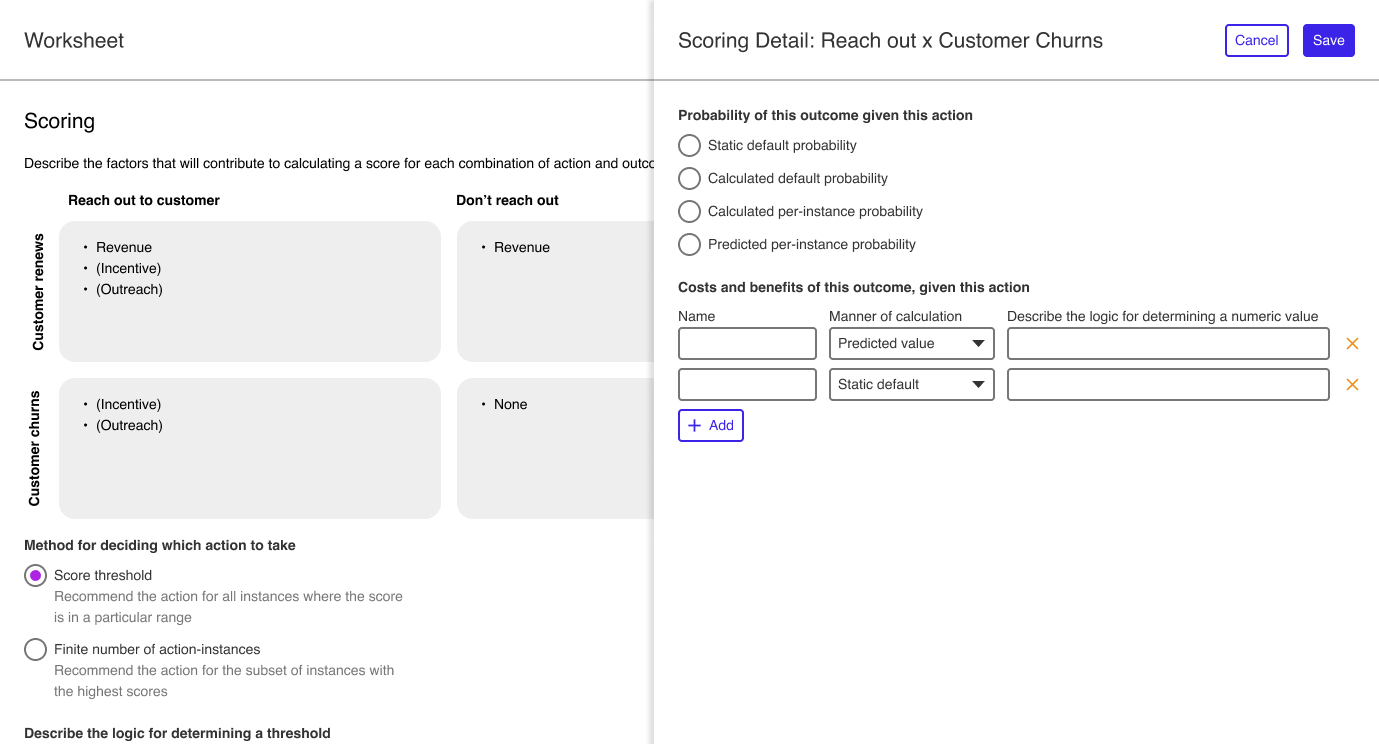
I had read the book Data Science for Business and seen that it outlined similar problems, as well as a set of approaches that helped bridge the gap between data science and business outcomes. A main innovation in the book was the "expected value framework". With permission from the author, I adapted this to software.
If folks followed it, I was certain that it would help the business stakeholders map their problems to data science process and help Data Scientists understand the business context. The first version was pretty complicated....
A requirements gathering UI that frames questions both personas should understand. It also outlines a set of decision-making steps to help ensure alignment.
A UI for guiding both personas to collaborate on the "Expected Value Framework"
When we showed this design to users we heard two main themes.
We heard:
We also heard:
Our takeaway was that our problem is real and that users see value. We decided to ship first and then iterate to get to something that was differentiated and more feature-rich.
In hindsight, we should've paid more attention to the "integrations" note. (*Foreshadowing...*)
We found a technical co-founder and developed this into a beta. We got 50 customers to sign up and try it. None of them continued to use it regularly.
This was highly disappointing. I fully expected to get things wrong and to learn. But having 0% adoption was a heavy blow.
As we talked to customers, the story we heard was: "This is just a Google doc."
I identified three main opportunities that were coming through in the research:
We decided that differentiating from existing tools was the key thing that we could do to try to get adoption. This would also avoid prematurely expanding our surface area. Instead, we would improve our existing features by making them more visual and adding richer functionality.
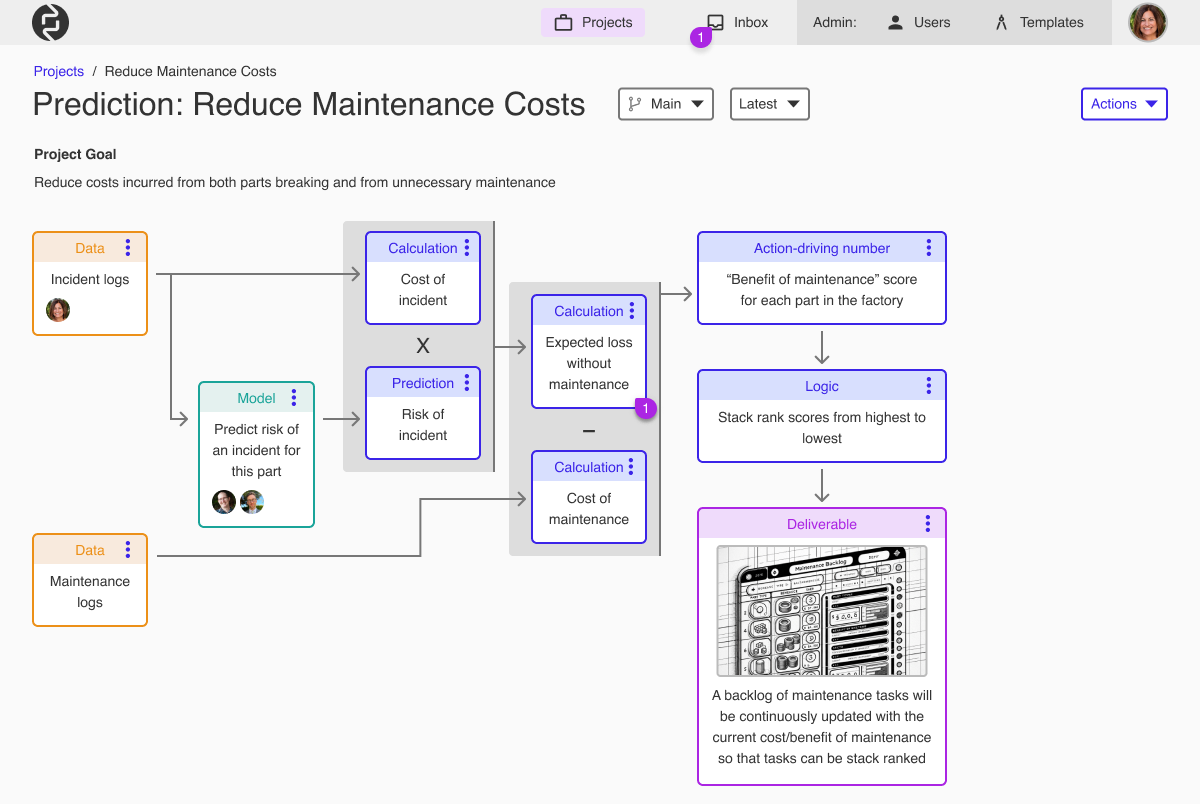
V2 of our beta was a visual flowchart of project requirements, which focused on a few points of improvement:
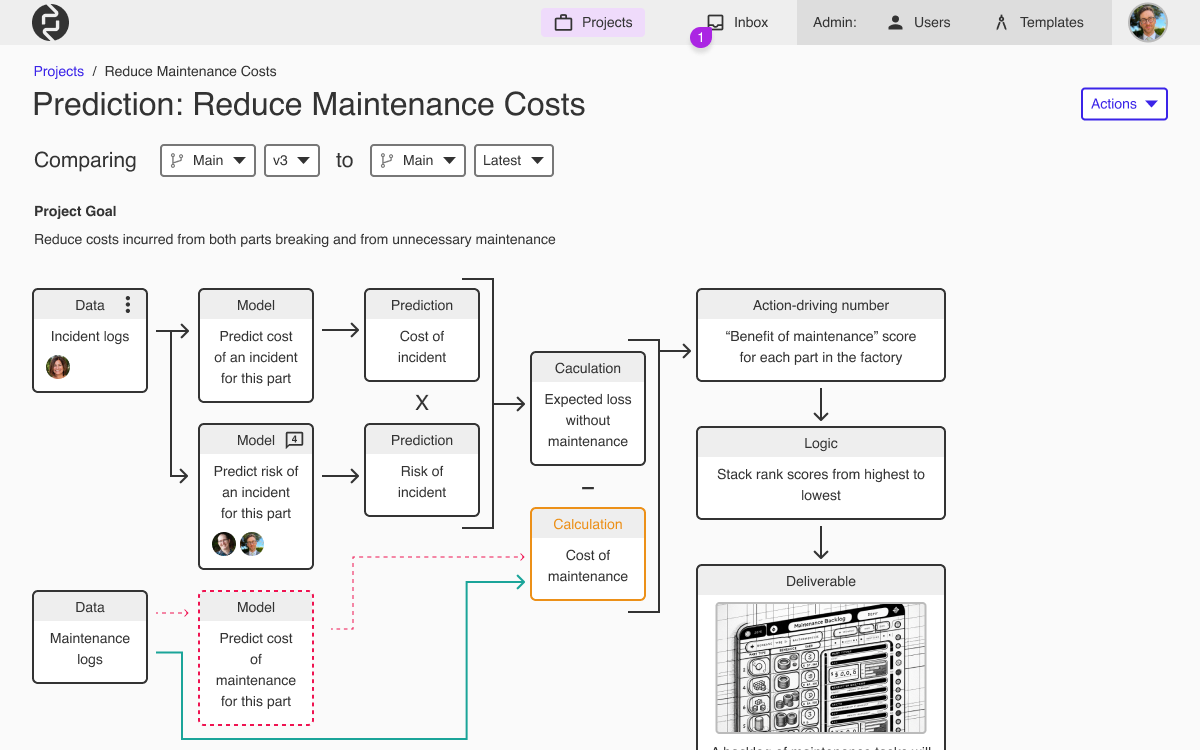
We reimagined the background information and expected value framework as an interactive flowchart with inline comments and live collaboration
This also made it much easier to represent the changes that happened between two versions of the project
After shipping this, we still struggled to gain adoption. We repeatedly heard that folks would need more features and more integrations in order to adopt. We didn't have runway to build these and so ultimately we cut our losses.