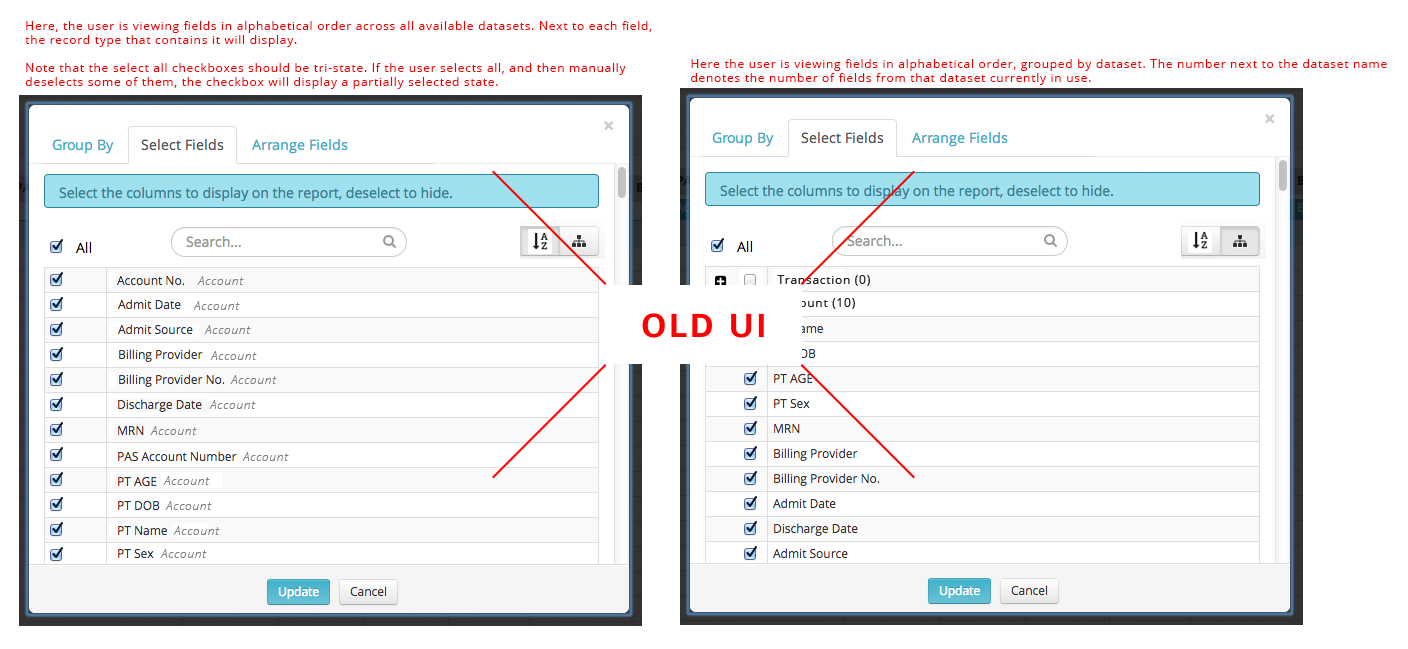
Old UI
The old UI was unintuitive and only showed users a subset of their data
Make it easy for customers to join datasets
Got requirements from PM. Led design. Collaborated with Eng.
Users wanted to look at data from multiple tables in a single report. This required joining the data in the tables. The PM knew his users needed this functionality but was concerned that the interface would need to be very complicated.
The old UI was unintuitive and only showed users a subset of their data
I knew that to make the feature simple, I needed to understand how the join functionality worked. So I started by reading the documentation for PostgreSQL. I then began interviewing users about how they worked.
As I started to organize the various things a user could do, I came up with a logic that could infer the configuration of the join without any additional input from the user than which columns and rows they wanted. I mocked up a design that included minimal changes to the UI but allowed the user to create the joins they needed.
After checking with the PM that this met the need and checking with Engineering that this was feasible, I began testing the interface with users. It performed well—the additional functionality was seamless and the outcomes matched users' expectations.
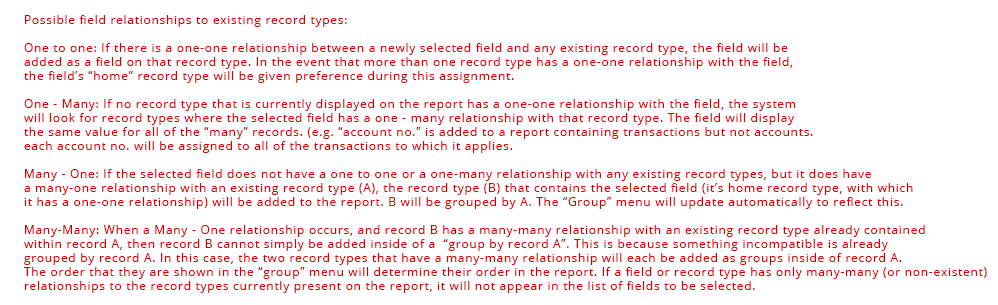
This was the logic that broke down all combinations into 4 situations. Each situation had one outcome.
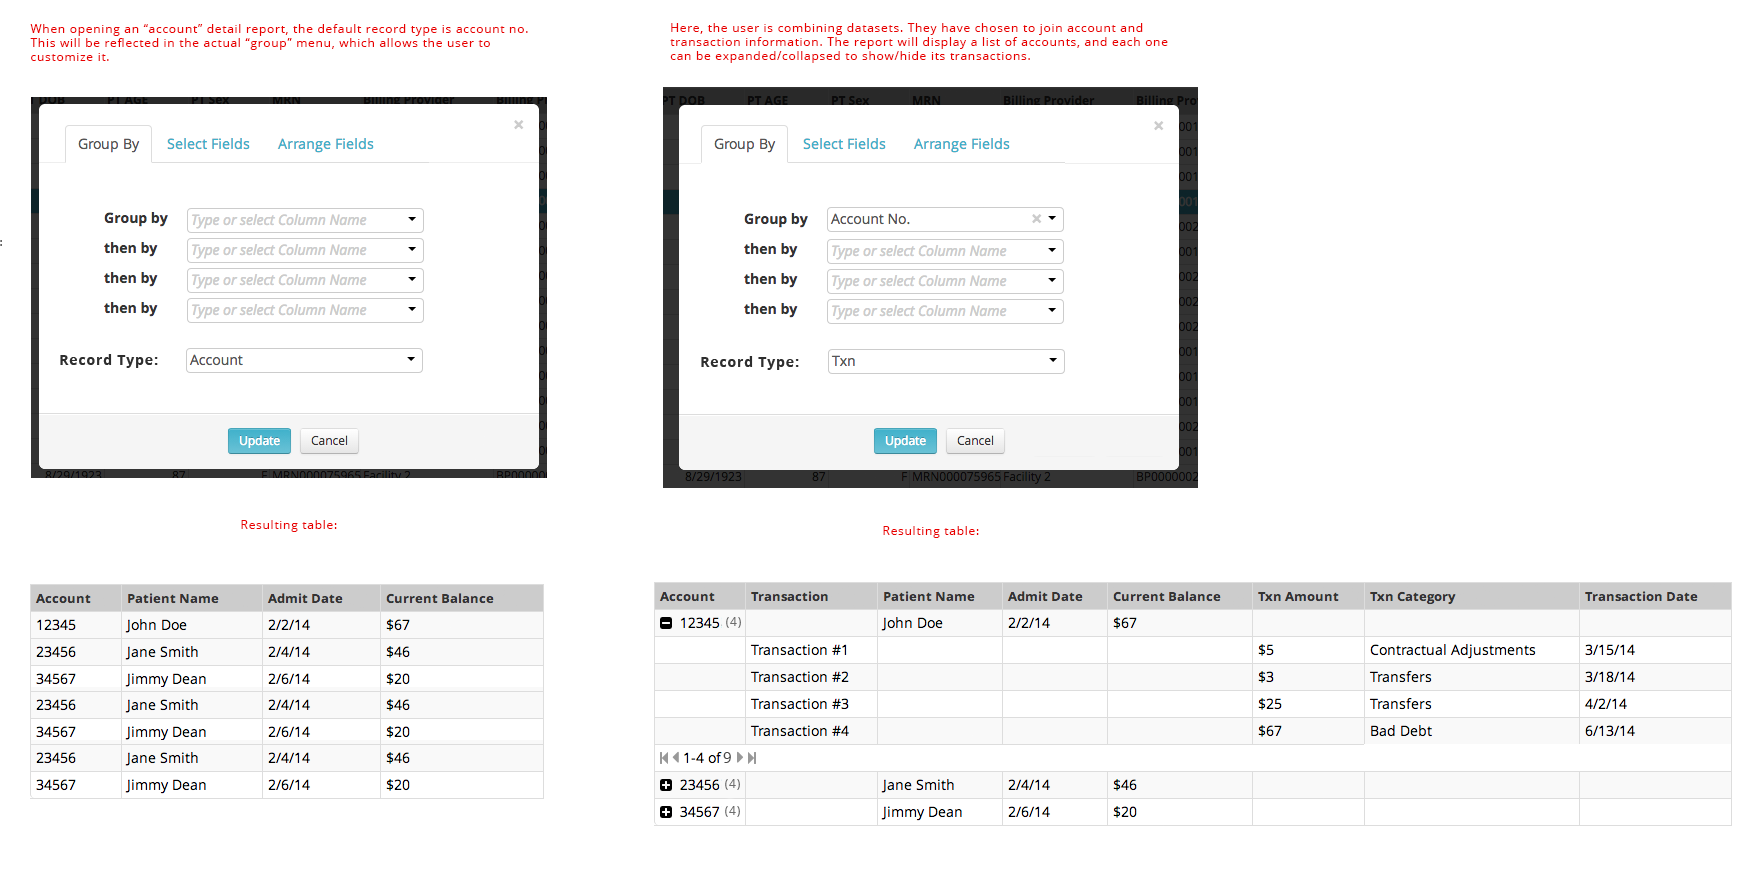
The solution was a system that did not require any additional input from the user. In order to expose the underlying system states, I added a couple of controls related to the new functionality. This was mainly so that power users could see which system state they were currently in and control it if they needed to. But non-experts did not need to view or think about these UIs. Users were really happy to be able to include more fields in their report.
For power users only, there was a UI that captured the system state and could change it